I’m celebrating my 100th visualization created for Tableau Public! When I pause to reflect on how many hours have gone into my personal visualizations over the past 4 years or so, it can sometimes feel a bit crazy to me that I have spent such a significant portion of my free time this way – but I really do enjoy it and I always come away from EVERY piece of work having learned something new or inspired in some way. Spending your precious spare time this way is not something that everyone can understand – a bit like running! – but if you know, you know.
For this special occasion, I decided that I would finally finish a project I started a long time ago that was sitting dormant – my attempt at the Iron Quest Travel & Vacations project theme from September 2021, which was exactly one year ago! I was delighted at the time when the topic came up because I had been meaning for ages to do some kind of visualization related to my travels using a world map, but I just never got around to it… so I finally had a reason to work on it. Somehow despite my enthusiasm, I never got around to finishing it.
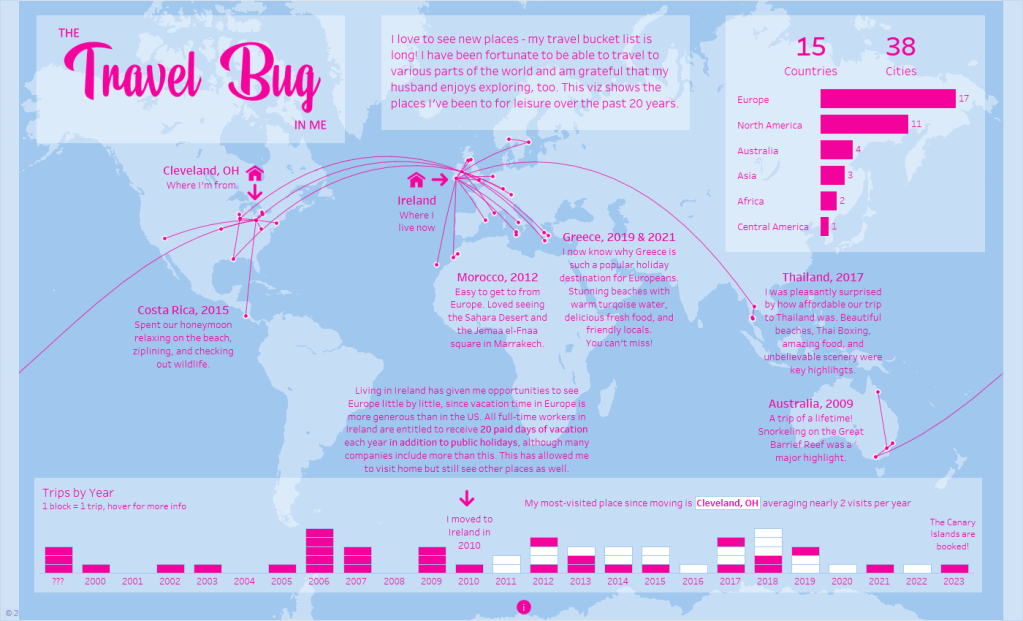
In this blog post I wanted to share some details behind my 100th Tableau Public visualization, The Travel Bug In Me.
Inspiration:
The key source of inspiration came from Kimly Scott’s viz The Stamps In My Passport that she created for the Iron Quest Quantified Self project theme in 2020. I know that plenty of others love it too – it has over 20K views on Tableau Public and I’ve spotted several folks in the wild who appear to have tried replicating it.
The Data:
The key piece that I had wrong when I initially got started making the map to show the very cool-looking flight paths or arcs, was the structure of my data. If you’re wondering how your data needs to be structured to be able to produce the paths connecting cities, it should go something like this:

The key items I missed initially were 1) having a row ID that’s going in sequential order between cities, giving each row a unique identifier to put on the detail card, and you need to 2) have the origin and destination details for a single path (point A to B) on the same row.
The Map:
Marc Reid put together an easy-to-follow blog post on flight paths in Tableau earlier this year. It made it very easy to understand how to create the arcs using Map Layers and the MAKEPOINT and MAKELINE functions that were introduced in Tableau Desktop version 2019.2. Jeffrey Shaffer has a great blog post for this topic as well.
Once I had the arcs in order, I thought it was a good opportunity to dip into Mapbox and have a play around to see what I could come up with. After much back and forth, the template I ended up using could really have been done in Tableau on its own. Regardless, it was a great refresher in Mapbox to try out the various bells and whistles and see what possibilities there are.
Mapbox:
Here are the steps to create a template using Mapbox and bring it into Tableau:
1 – You’ll need to create a Mapbox account at mapbox.com – you can go with the ‘pay as you go’ plan, which means you can load up to a certain number of maps. I doubt you’ll max it out unless you make maps for a living!
2 – Sign into your account and click on Create a map in Studio
3 – Click New style
You can start from scratch completely by choosing a Blank template, but I found it was easier to start with one of the other templates available and make changes from there

4 – Once you click Customize [template name], you’ll see options along the left where you can make changes to it – when you’re finished, click on Publish near the top-right corner of the screen
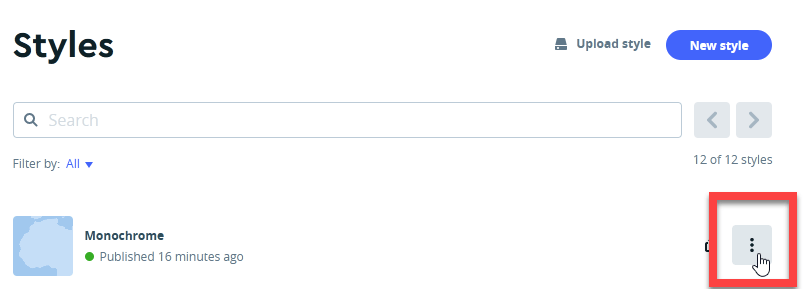
5 – Click Styles near the top-left, it will bring you to the list of Styles that you currently have (you may keep adding to this!)
6 – Click on the 3 dots on the far right of the style name you’d like to work with
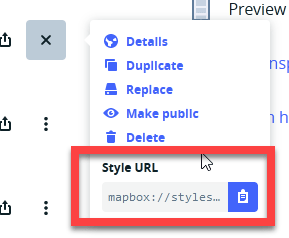
7 – Copy the Style URL and paste it somewhere like Word or Notepad so that you can come back to the text
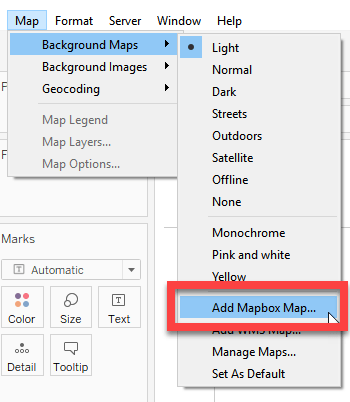
8 – In Tableau, go to Add Mapbox Map
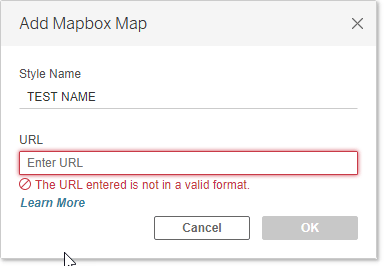
Add a style name (it doesn’t have to match what you called it in Mapbox). For the URL, it must be entered in this format:
https://api.mapbox.com/styles/v1/<username>/<styleid>?access_token=<access token>
9 – Find what you pasted from Mapbox (into Word or Notepad) it will look something like this:
mapbox://styles/katiekilroy/cl7yv1jve00321phpc4phz
You need to plug the details from what you copied in Mapbox into the format mentioned above in step 8 – in this case the URL would look something like this:
https://api.mapbox.com/styles/v1/katiekilroy/ cl7yv1jve00321phpc4phz?access_token=<get your access token and paste it here, don’t include the < and the >>
Once you have the above link formatted correctly, THAT is what you will paste into the URL field in screenshot below.
10 – You’ll notice in Tableau that you can navigate to any of the custom Mapbox maps you may have created and connected to, so you can toggle between them to see which one you might prefer, depending on your project:

Here’s another helpful resource from Tableau for using Mapbox Maps with Tableau: https://help.tableau.com/v2021.1/pro/desktop/en-us/maps_mapsources_mapbox.htm
Click on the image below to see the interactive version of my visualization, The Travel Bug In Me, on Tableau Public.
Lastly, I wanted to give a special thank you to Michelle Frayman and Nicole Klassen for their feedback during their Viz Office Hours (check #VizOfficeHours on Twitter for details)! They gave me great encouragement and some great ideas for improvement – cheers, ladies!!
I hope you found this post helpful – thanks for reading.
Update – this visualization was featured as “Viz of the Day” on Tableau Public in late September 2022 after this post was published.
