
I recently gave a talk at the Cork Tableau User Group about why you should start using Tableau Public and thought I’d transfer the content over to a blog post. If you found this post through the Tableau Community, there’s a good chance you’re already using Tableau Public and realize the value in doing so. But if you’ve found this post through some other channel and you’re not too sure what Tableau Public is all about, then I’m writing to you specifically – please read on and I hope you’ll consider getting started with it ASAP!
What is Tableau Public?
While Tableau describes what Tableau Public is here, I tend to think of it as two general things:
1) The website itself: public.tableau.com
This is where you’ll find the Tableau Public Gallery that contains a seemingly endless number of data visualizations, resources, and blog content. Featured visualizations are grouped by themes, for example, Healthcare, News and Events, Education, Arts, Public Sector, Business Dashboards, etc.
While you can create visualizations from scratch in the web-edit/browser version of Tableau Public, my personal preference for working with the tool is via the free Desktop version, mentioned in point 2 below.
2) The free software that you download to your PC
It’s pretty much the same as a Tableau Desktop license that you might use at work (a paid license), in terms of functionality – but the two key differences are that a) in the free version you are limited in the types of data you can connect to and b) you can’t save your work to your local machine; instead you have to save it up to public.tableau.com. You can, however, hide anything you don’t want to share publicly.
A word of caution: while you can hide your work, I do not recommend ever using Tableau Public with sensitive data. Stick to public/non-sensitive data.
Tableau Public is completely free to download and use. While there are many other data visualization tools available that are also free, these are generally web-based with no option to download and do not necessarily have the extensive gallery, resources, and community that Tableau Public does.
How did I get started on Tableau Public?
I got started with Tableau Public after the inaugural Cork Tableau User Group meeting back in November 2017. Kevin Lynch from The Information Lab Ireland was one of the presenters that evening and he took us through his approach to creating visualizations for Tableau Public. At the time, I had heard of it but I didn’t really know what it was for or why you’d want to use it. He showed us a few interesting pieces of work and it piqued my curiosity – when I got home that night, I cracked open the laptop, set up a profile, and had a surf around the Tableau Public Gallery.
I can’t recall exactly how I came across the Makeover Monday project, but that’s what really got me hooked! Fast forward to 2023 – I have managed to create over 100 pieces of work that I’m very proud of. The new skills and learning I have accumulated along the way as well as the comradery from the Tableau Community have been incredible and game-changing for me.

The Benefits of Using Tableau Public
1) You can learn from others
By participating in a data project in the Tableau Community via Tableau Public, you will learn a lot from others. I am still amazed how 50 people can all work on the same project objective with the same data and 50 different visualizations will come out of it… often with different angles, presentations, and insights. When you worked with the data yourself and then see all the various ways people chose to present it, this helps to broaden the way you think about and approach new data sets.
Many people make their Tableau Public workbooks downloadable*, which means you can look at how they did what they did. I can’t recall the number of “Ah-ha!” moments I’ve had from reverse engineering workbooks I’ve downloaded and this is arguably one of the most compelling reasons you should start using it. Many times I had assumed something was complicated, but when you look underneath the hood, so to speak, you can see that it’s more straightforward than you may have thought. The opposite can be true as well, but it all leads to learning.
*If you are inspired by someone else’s work or their workbook has significantly helped you form your own piece of work in some way, it’s always a good idea to give that author credit or a mention of some kind, if and when you publish or otherwise share your work. See the Community Code of Conduct on this topic.
2) You can explore what’s possible in Tableau
The Tableau Public Gallery blows me away sometimes (well… most of the time!). It felt like a few years back that ‘pretty’ visualizations or data art – things that wouldn’t necessarily be suitable for a business ask – seemed to be most prevalent or noted in the gallery. However in recent years, I am finding more and more business-related dashboards, guides, and tools being created and featured, which is fantastic. While I would suggest that most Tableau Desktop users are approaching their use of the tool with a business dashboard objective in mind, many of these artistic-leaning pieces of work push the boundaries of what Tableau is capable of and can still, in turn, inspire ideas for how to present information, choose color schemes, format and structure dashboards, and ultimately help you think about how to tell a story with data for business purposes.
Below are links to some of my favorite references on Tableau Public that could be helpful to you from a business perspective:
- Robert Rouse’s Bar Chart Menu
- Jeffrey Shaffer’s Bar Hopping: Theme and Variations on a Bar Chart
- Adam McCann’s KPI Options
- Kevin Flerlage’s Tableau Chart Catalog
- Lindsay Betzendahl’s Top 10 Business Dashboard Tricks
Feel free to check what I have marked as a favorite on my profile for more like the above.
To find more business-related publications on Tableau Public, I’d suggest using the following search terms (or similar) within Tableau Public’s search function:
- Business
- Guide
- Color / Colour
- Supply Chain
- HR / Human Resources
- Call Center / Call Centre
- VOTD / Viz Of The Day
- Sales
- RWFD / Real World Fake Data
3) It becomes a portfolio
As you publish visualizations to your profile one by one, this becomes a portfolio for you. So the next time you are job hunting and you’re looking for a position that requires Tableau Desktop skills, you can do more than just say “Yes, I know how to use Tableau.” You can actually prove your abilities and range of skills through your portfolio. When it comes down to the last round of interviews for a role, having that portfolio could be what pushes you ahead of the rest.
I would suggest that it also demonstrates that you can take initiative and learn independently, which are invaluable skills to any potential employer.
4) It shows how you have developed your skills
The default sort of workbooks on your Tableau Public profile is reverse chronological (most recent at the top, oldest at the bottom). I have often scrolled to the bottom of someone’s profile whose work I admire to see how their style and skills have evolved since their earlier publications.
This is another aspect of proving that you can learn and develop new skills through your profile, from a job hunting perspective.
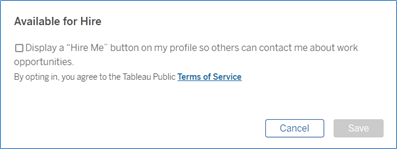
5) There’s a “Hire Me” flag for your Tableau Public profile
Tableau Public recently introduced the Hire Me flag for your profile. When you are logged in, go to Edit Profile. You’ll see the below image near the bottom-right corner of the screen. By enabling this feature, you can make it clear to hiring managers who may be looking at Tableau Public that you are available for work.
6) It’s a great option for non-profits and similar
Considering Tableau Public is free, it’s a great potential option* for charities, non-profits, journalists, or even local authorities who may not have financial support for a license, but still want to share their data stories with a public audience and help reinforce their message.
*Just make sure you are using it within the terms and conditions of Tableau Public… and again, don’t use sensitive data.
7) It’s the best way to practice

The only way to get good at anything – whether it’s a sport, musical instrument, public speaking, or anything in between – is to practice!
Tableau, or any tool for that matter, is no different. Why not practice using data that is entirely different and potentially more interesting to you, in a general sense, than data from work? If you like music, connect to some Spotify data and see what you find. If you like football, find the Sports Viz Sunday project and go from there. If you like digging into local issues in your area, find any publicly-available data from your region and see what insights you stumble upon. It doesn’t matter what it is, but if it’s something that you are actually interested in, you may have more fun practicing!
How to get started

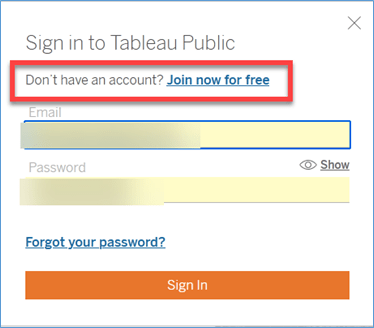
Go to public.tableau.com and click Sign In > Join now for free and set up a profile:

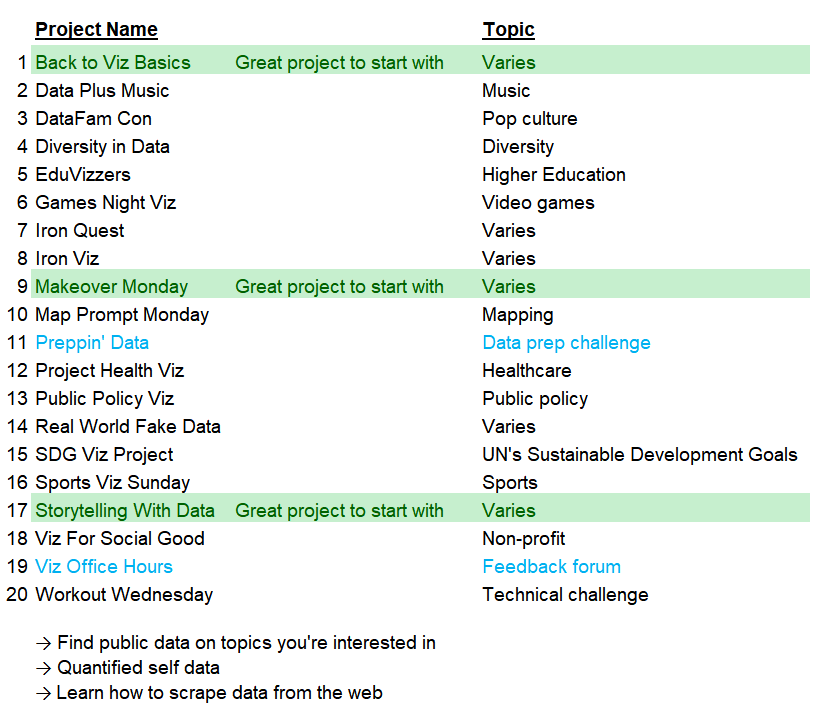
Dive into one of the many data projects that are run by folks in the Tableau Community. I’ve compiled a list of data projects below based upon a recent Data Fam Round Up post (scroll to the bottom to find links to the projects themselves).
While you could get started with any of these, I’ve flagged the ones that may be good starter projects in green. The projects in blue are slightly different in that Preppin’ Data isn’t for data visualization but for data preparation. While it’s a tool agnostic project, many participants use Tableau Prep to complete the challenges. Viz Office Hours is an opportunity to get feedback on your work from dedicated members of the Tableau Community who are passionate about data visualization and Tableau. This is a great opportunity to iterate and improve the quality of your work, while at the same time pushing you to figure out how to do new things with Tableau.
Here is another link to data projects on the Tableau website.
Below are links to other blog posts related to this topic as well, to provide additional perspectives.
- Tableau Public Explained and How It Can Help Your Career
- Ten Reasons Why You Need a Tableau Public Profile
- Why and How to Connect With the Tableau Community
I hope this post has been useful and encourages you to get started on your own journey with Tableau Public. Thanks for reading!
Practice photo by Brett Jordan
Steps photo by Jukan Tateisi
Thank you Sarah Molina and Louise Shorten for your inputs!
