A scenario that comes up regularly in the Tableau Community Forums is where a user is looking for help on a Tableau problem that is work-related and they say that they can’t share a packaged workbook that demonstrates their problem because the data is confidential.
This is very common and understandable – I can’t say I’ve ever worked for a company that was OK with sharing proprietary data in a public forum!
What you can do to get the help you need via the forums – or any external resource, for that matter – is spend a little time anonymizing some of the fields and/or values in your real data, so that any calculated fields, views, dashboards, etc. that you’ve created in Tableau will still demonstrate the problem you’re experiencing. Once you have the data in a shareable state and your workbook is pointing to the fake data (and the real data has been removed), you can save the Tableau file as a packaged workbook – this is the file type that will contain a copy of the (fake) data and allow other users to open it with Tableau Desktop to see what you’ve done.
If you include this packaged workbook with your forum post, the forum volunteers are more likely to respond. It’s a case of help-us help-you.
While this is helpful for the Tableau Community Forums, it may also be helpful internally within your own company when you are providing support to or seeking support from other departments who may be working with sensitive data.
Here are the high-level steps to make your data anonymous:
- In your original Tableau workbook, do a Save As on the file, so that you leave the original document unchanged
- Copy a sub-set of the real data and paste it into Excel or Google Sheets
- Manually update as many columns, headings, values, etc. as necessary to make it generic
- Save the Excel file and close it – if using Google Sheets you must download as a .xlsx file
- In the Tableau workbook, change the data source over to this ‘fake’ one and close the real one
- Export the workbook as a packaged workbook
- This packaged workbook is what you can share in the forum accompanying your post to demonstrate your problem
Here are those steps in detail:
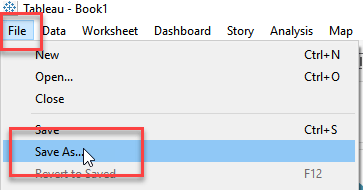
Step 1. In your original Tableau workbook, do a Save As on the file, so that you leave the original document unchanged
Give this new version of the file a memorable name and store it somewhere relevant – at this point, saving it as a .twb extension (a workbook) is fine. The purpose of this step is to ensure you leave the original version in tact while you modify a new one – just in case you make a mistake along the way.
If this is your first time doing this, I recommend completing step 1. If you’ve done this before and are comfortable, it’s fine to go straight to step 2.
To understand the different Tableau file types, click here.
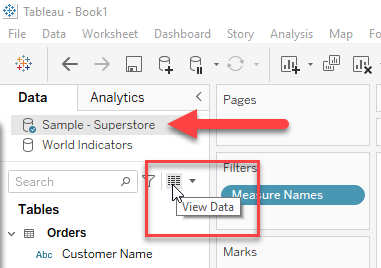
Step 2. Copy a sub-set of the real data and paste it into Excel or Google Sheets
Working with the version you did a Save As on, click on the View Data icon near the top-left area of the screen. This will display the underlying data in a new window. If you have more than one data source, ensure you’re clicked onto a view/sheet that is pointing at the relevant data source. Look for the blue check mark to know which source it’s referencing.
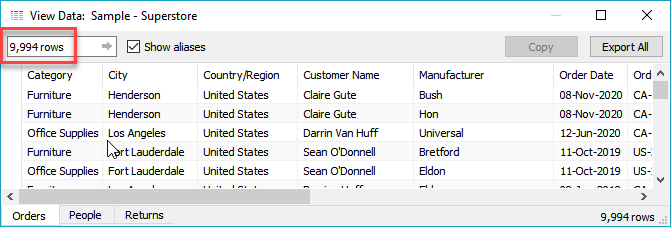
Reduce the number of records you’re copying by typing directly into the box in the top-left that shows you the number of rows, like below (the box where you see “9,994 rows” – replace that with “100”, for example). You may need to consider carefully how many to rows are needed to maintain the level of the data – this is important so that you can sufficiently demonstrate your problem. However, a sub-set of the data of some kind should be enough.
Copy the records by clicking the top-left corner (to the left of ‘Category’ below) to highlight everything and then click the Copy button.
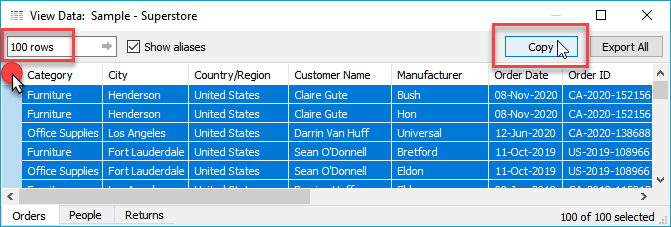
Paste the abbreviated data into Excel (or Google Sheets).
Step 3. Manually update as many columns, headings, values, etc. as necessary to make the data generic
This Excel sheet is going to be our new fake data source. In the Excel sheet, apply a filter to the first row and work through each column manually to make changes to the data (ideas you can use are food names, shape names, colors, car model names, places, letters, dummy products, mock-up some names of people, etc.). It’s ideal to leave the column headers as-is if you can, and just change the content of a column. If you must disguise the headers, make a mental note of what the original and new names are. If you change the headers, these are the fields that will ‘break’ when we connect the Tableau workbook to the new fake data. It can easily be fixed, but the important thing is to remember the new name you may have given a particular field.
You also need to delete any columns containing calculated fields that you created in Tableau.

An important note for this step is that Tableau will show any calculated fields you created when you go to View Data. Since we’re going to feed a ‘fake’ version of this data back into Tableau, you need to remove (from the fake version) any columns that represent calculated fields. This is because when you switch the data source over to the fake version, you want Tableau to simply slot the fields you just made generic right into the calculations you created.
If you do forget to remove them before connecting to your fake data, it will still work. However, your list of dimensions and/or measures may look confusing because you’ll see two versions of any calculated field – once as you originally created it and a second time as part of the ‘underlying data’, since you’ve essentially fed it in as a hard value. If you remove calculated field columns from the fake data set before connecting to it, it will be cleaner.
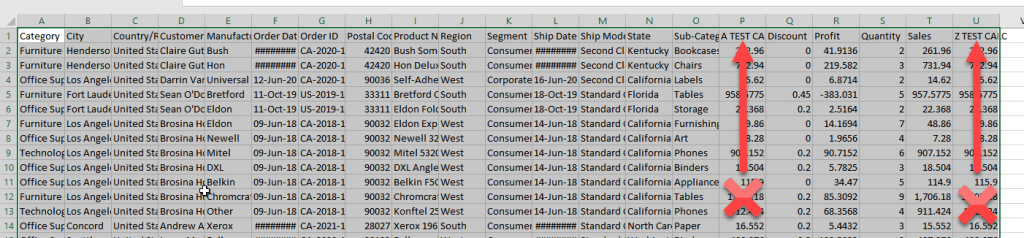
As an example, below you see two calculated fields that were copied via View Data, pasted into Excel, and need to be deleted from the Excel before saving.

In screen shots below, the columns containing the two calculated fields should be deleted.
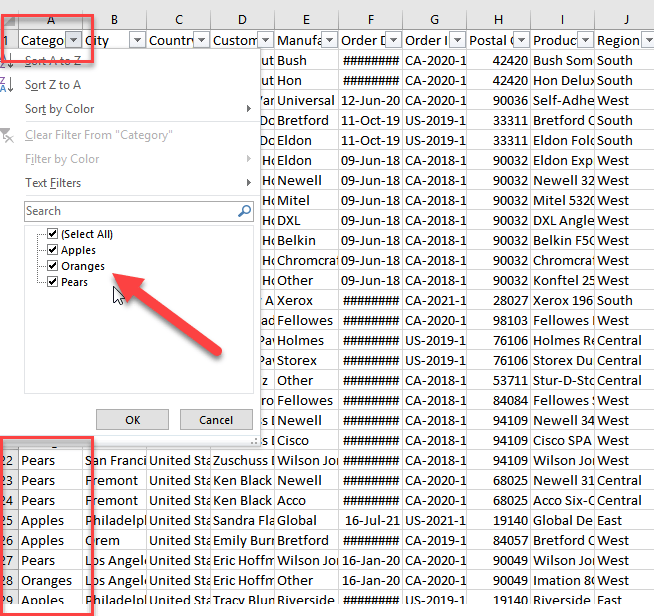
In the Category column below, a filter was applied – every cell in that column that said Furniture was changed to Apples, Office Supplies was changed to Pears, and Technology was changed to Oranges.
Another important note for this step – ensure you have expanded all the columns in Excel so that you don’t have any that appear like “#######” before saving. Otherwise, Tableau may not read in the data properly. You can simply CNTRL + A (select all) and then double-click the right-hand border of any column header to auto-expand all columns.
TIPS RELEVANT TO STEP 3:
Tip #1: In Excel, when you are pasting in the fake cell content, I recommend typing “Apples”, for example, into one cell, copy that cell, select the cells that need “Apples” pasted into them with your mouse (after you’ve filtered to whatever needs to be changed to “Apples”) and then typing CNTRL + V on those selected cells to paste the word “Apples” into them specifically. If you hover over the bottom-right corner of a cell that you typed “Apples” into and use the double-click short cut to have it paste down the whole column, I have found that it may behave unexpectedly (depending on your Excel settings) and potentially paste “Apples” into cells that you don’t want it to (cells that you haven’t filtered for). By selecting the exact cells you want to paste it into when the filter is applied, you prevent that from happening and potentially distorting the level of the data.
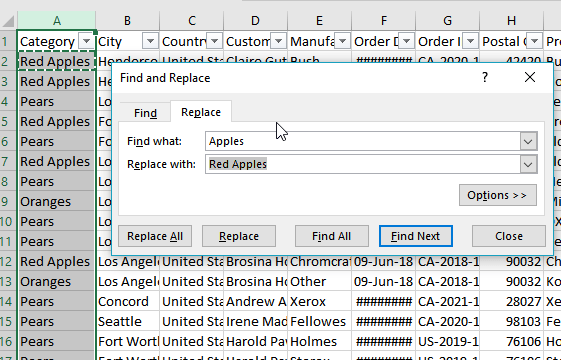
Another way to do this is highlight a single column and use the Find and Replace function (shortcut CNTRL + H) in Excel. In this example, you could Find Apples and Replace All with Red Apples. You must ensure the column has been selected with your mouse first, otherwise it will apply the change to the whole sheet rather than just that single column.
Tip #2: If you have numerous fields/columns and you can’t figure out which ones are calculated fields, the sequence in Tableau on the data pane (top to bottom, dimensions first, then measures, both alphabetical) matches the sequence when you paste it in Excel (the top row with headers left to right, dimensions first, then measures). This can be re-ordered and sorted in the View Data window by dragging columns and clicking on their headings, but the default order if you don’t change it is as previously mentioned. If you have fields inside of hierarchies or folders in the data pane, the alphabetical sequence in the data pane will consider the name of the hierarchy or folder. But when you paste into Excel they will be alphabetical by the fields themselves, regardless of any hierarchy or folder they are part of.
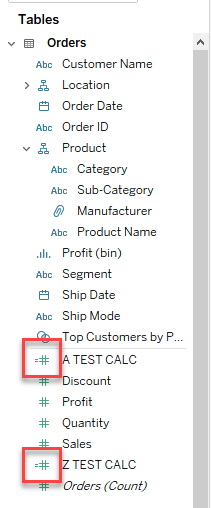
Tip #3: Calculated fields can also be identified in Tableau’s data pane (for both dimensions and measures) by the small equals sign that precedes the data type icon and name of any field, like below.
Step 4. Save the Excel file and close it – if using Google Sheets you must download as a .xlsx file
Save your Excel file containing the fake data with a memorable name in a relevant location.
Step 5. In the Tableau workbook, change the data source over to this ‘fake’ one and close the real one
Go to Data > New Data Source, navigate to the fake data Excel file and select it:

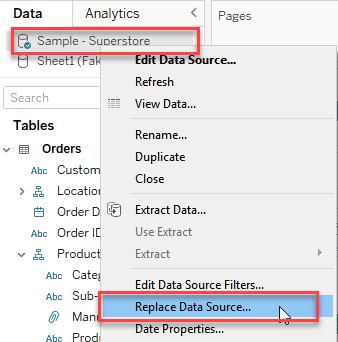
Right click on the real data source from the data pane > choose Replace Data Source:
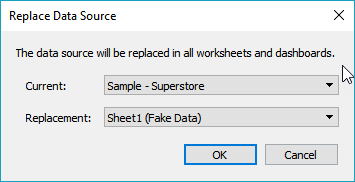
You’ll see a message similar to the below (Current: real data, Replacement: fake data), click OK:
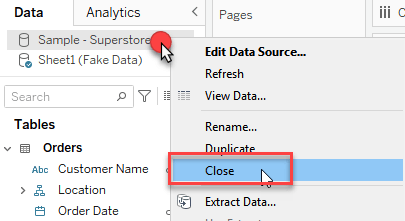
Right-click the original or ‘real’ data source in the data pane and select close to remove the source from the workbook completely:
You now have a workbook pointing to an anonymized version of your original data.
Step 6. Export the workbook as a packaged workbook
Go to File > Export Packaged Workbook and save it with a memorable name in a relevant location.
You’ll notice that the file extension is now .twbx and the file icon has a brown stripe on its left side.

Note that if your data source is not file-based (for example, on a server or in the cloud), you need to create an extract of it before saving the packaged workbook. See this knowledge base article for more on saving as a packaged workbook.
Step 7. This packaged workbook is what you can share in the forum accompanying your post to demonstrate your problem
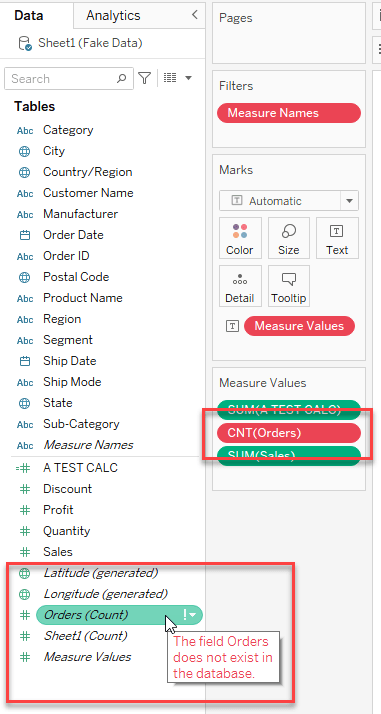
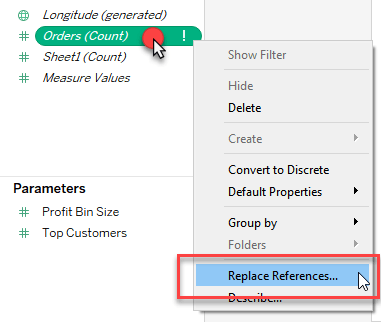
Another tip: If you discover that some of your fields (AKA “pills”) have turned red in Tableau when you switched to the fake data source, this means exactly what the error message tells you when you hover over that pill in the data pane, that the field no longer exists in the data source. This is likely to be a column heading that you changed in the fake data. Tableau doesn’t know what to do with the pill anymore because it can’t find it (since it’s not there, because you changed the name!).
To fix this, you need to tell Tableau what to do about it. Right-click on the pill in the data pane (it will have a red ! to the right of it) and choose Replace References. This is the mental note I was referring to in step 3 – select the new name you gave to that column header in the fake data, and the red color and the ! will disappear.
You will probably get the red ! showing for the field named TableName (Count) as well, if the sheet name containing the fake data in Excel has a different name than the table name in your real data. Just use Replace References as mentioned above to direct Tableau to the new field. The ‘new’ field is likely to be Sheet1(Count) if you didn’t change the name of Sheet1 in the Excel file. If it’s not Sheet1(Count) then it will be called TheNameOfTheRelevantExcelSheet (Count).
If you don’t get this red error at all, it’s probably because you’re using an older version of Tableau – for more on this topic, read this post.
Best of luck to you participating in the Tableau Community Forums and I hope you have found this how-to document helpful.
Thanks for reading.
Thumbnail image by Gerd Altmann from Pixabay

Thanks Katie, this is very helpful. I especially like the tips in Step 3.
LikeLiked by 1 person