I wasn’t going to do a look-back of 2021 in terms of data and Tableau community-related things this month, but when I saw other posts start popping up on Twitter on this topic last week, I couldn’t help myself! I was actually quite surprised – and pleased, once I tallied things up – with what I did manage to accomplish in 2021 on top of all the usual life stuff during year two <sigh…> of the current pandemic.
I made a list in Excel and put together a very quick newpaper-y viz:

For a little more context…
Publishing visualizations on Tableau Public
I managed to participate in four new projects for the first time – #DiversityInData, #IronViz, #SportsVizSunday and the recently-launched #DataPlusMusic. It felt great to get out of my project-go-to “pattern”, engage with some new folks in the community, and learn a few new tricks along the way.
Published a blog post or article
Early in the year I put together an article for Nightingale on data scaffolding, which was a written version of a presentation I gave for the Tableau Fringe Festival at the end of 2020. This was really beneficial because, even though I use the technique fairly regularly, putting it into writing (so that someone could hopefully follow it and learn from it!) cemented those concepts into my head. On the blog front in the new year, I definitely hope to at least match or beat my number of posts from 2021 and would like to include some more how-to’s and/or technical topics. January-2023-self, take note.
Organizing Tableau User Group (TUG) meetings
The Data + Women Ireland crew and I managed to hold three virtual events in 2021, which is fantastic considering what a crazy year it was. We heard and learned from the following female experts to keep inspiration and spirits high for our Irish data enthusiast base (and beyond!):
- Andrea Paolella
- Eva Murray
- Jenny Martin
- Mary Aviles
- Niamh Brady
- Renee Teate
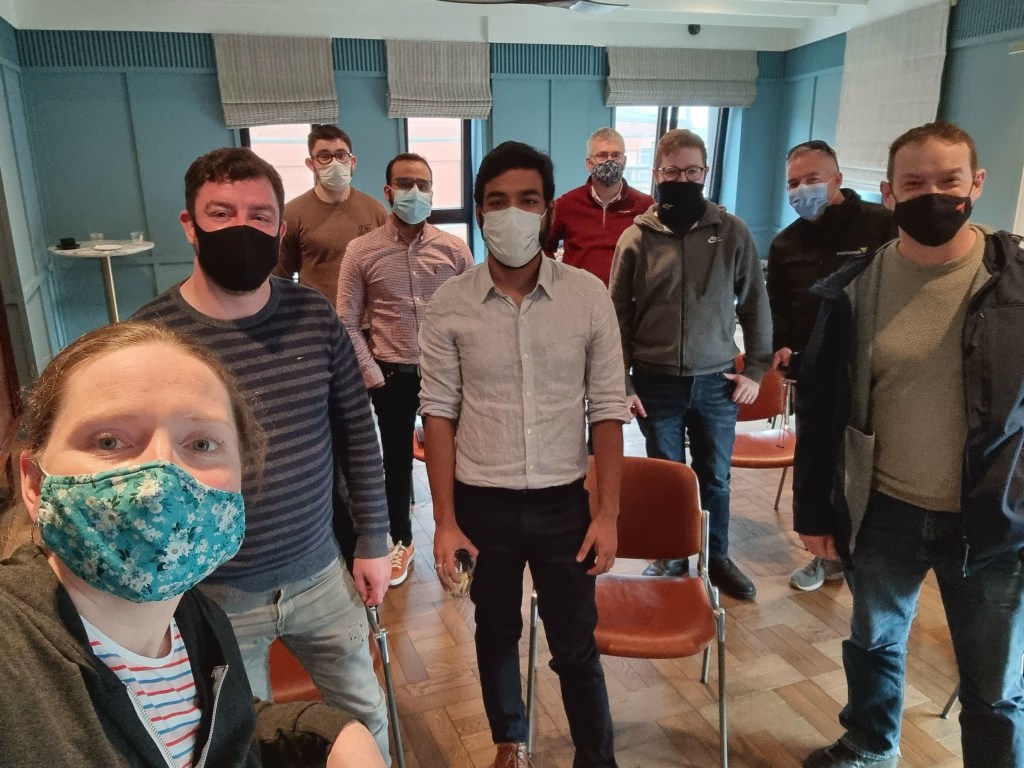
For a brief moment during all-things-pandemic it looked like a window had opened to have an in-person event, so I put together a live (too early to say old school?) TUG for the Tableau crowd in Cork. Like so many other TUGs, the Cork TUG hadn’t met in-person since January 2020, so meeting up this past November felt great! And we got it in just before COVID-19 managed to rock the boat again (thanks Omicron) and local restrictions/guidance to not meet in-person returned. We didn’t record the event or try to do it hybrid style, so I don’t have a link for you. But it felt great to see and catch up with some familiar faces again. We were fortunate to hear from these Tableau gurus:
- Andy McManus
- Hanut Mather
- Tiarnan Stacke
Presentations
One of the best ways to get out of your comfort zone is to get practice presenting to new audiences. Early in 2021 I gave two virtual workshops on data visualization to young aspiring engineers at a college conference and towards the end of the year I put a talk together for Ireland’s virtual TUG on the Tableau Community Forums. I hope I managed to convince a few folks on the merits of data viz and why you should participate in the Forums!
Other
I got a shout from the Tableau Public team during Pride Month on an older viz I had created back in 2020, which was pretty cool. And last but certainly not least, I became a Tableau Ambassador for the 2021-2022 year. This was (and still is) such a huge honor!
Wishing you all the best on your own personal journey(s) of learning in 2022.
Thanks for reading and happy new year!
