If you are thinking about a new data visualization project to get involved with, I recommend giving Viz for Social Good (VFSG) a try. I registered as a volunteer for VFSG ages ago but just never managed to get my act together to work on one of their projects until last month – finally! For September 2020, VFSG partnered with Bridges to Prosperity (B2P), a non-profit based in Colorado that aims to eliminate isolation and poverty by constructing foot bridges around the world, specifically in rural communities.
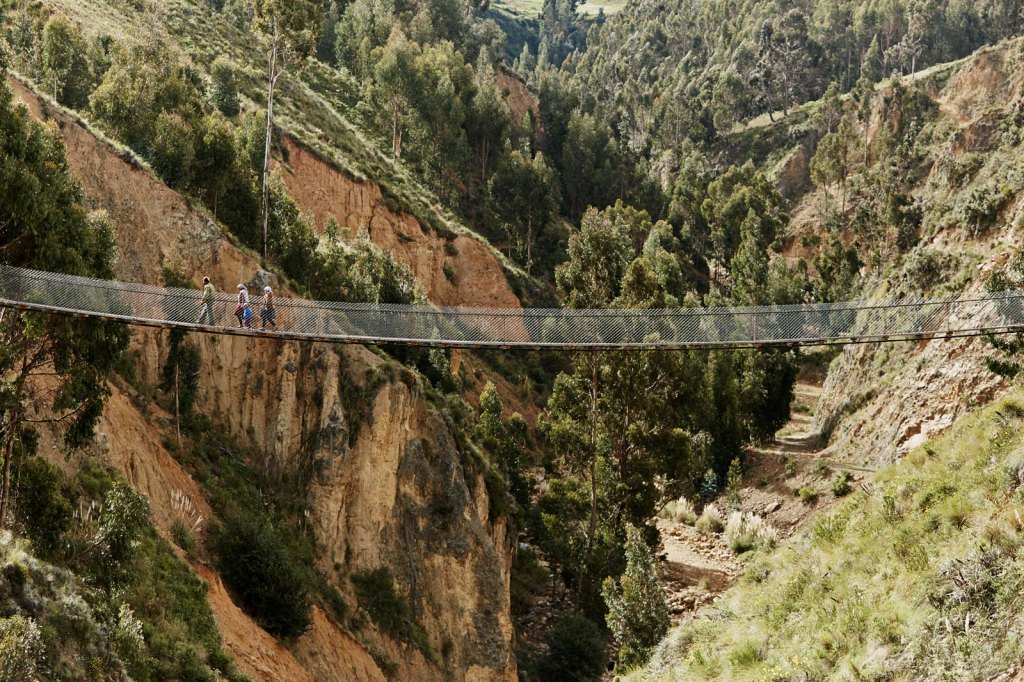
B2P do some really amazing work that you may have never realized was important or necessary. When I think of a bridge, I think of something along the lines of this:


But what B2P do looks more like this:
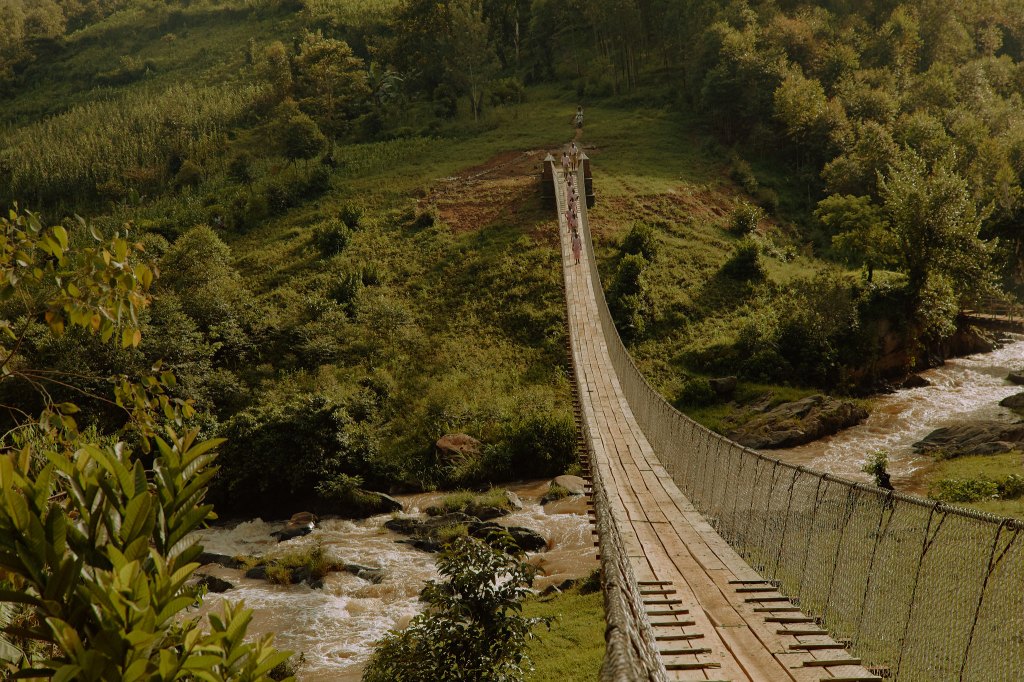


Big difference, ehh?
B2P recently conducted a survey of bridge users on some of the bridges they built in rural Rwanda to get more insight into how they are being used. By partnering with VFSG and their network, B2P was able to tap into the skillsets and passion of data geeks from all over and learn specifics about how their bridges are positively impacting families and communities in their day-to-day activities in Rwanda.
My approach
Initially when I read about what B2P do, I was genuinely blown away. I never thought much about the difference a bridge – something so common in some parts of the world – could make in someone’s life. I was compelled to create a visualization that would help them explain their mission and the massive impact they have on rural communities.
B2P provided a ton of data points and resources to work with, so the challenge was of course to decide on what would be most interesting to the primary audience – in this case potential donors and government groups. I wanted my creation to be very straightforward, simple, and quick to grasp for anyone who is not familiar with Rwanda itself or what B2P does.
New learning
I decided it was time for me to try a “long-form” viz – it’s quite possible that I had some kind of long-form-envy after seeing so many of this year’s brilliant Iron Viz submissions! I had done 1 or 2 medium-length vizzes before, but really I was just hacking at it and I shied away from doing something longer because of the challenge with layout and formatting. I have found that when a dashboard gets long/tall, you need to have patience for layout containers if you’re not familiar with them. But… once it clicks how they behave, you would seriously question the motives to NOT use them! So that was my key technical learning on this visualization – getting more comfortable with tiled containers. I’m not suggesting that I’m an ace now, but I’m certainly a lot better than I was pre-B2P-viz.
Here are two great videos related to understanding layout containers that I found extremely helpful:
- Tim Ngwena’s Tableau Layout Containers Explained in Under 10 Minutes I absolutely love Tim’s tip for coloring the containers as you go. This was a huge breakthrough for me because it helped me understand where things were and how tall/wide items became as you add or subtract them from a dashboard sheet.
- Andy Kriebel’s Layout Tips for Long Form Dashboards
Feedback and iteration
I got some great suggestions from fellow Tableau-enthusiast Sarah Bartlett for this viz, specifically, adding the border around the outside and framing the heading of each section as a question. Neil Richards also had a sneak preview and pointed out a couple things in need of fixing. Getting at least one other set of eyes on your work is always a must – I can’t recommend it enough if you’re not already in the habit of doing it.
I really liked how Frederic Fery included a quote from a bridge user on his viz and I also really liked the way Jyoti laid out the photographs on her visualization. So they were sources of inspiration for me and guided some of my decisions for design and content.
Presentation
The authors of a selection of vizzes were offered the chance to present their work to B2P on October 10th and I was delighted to have been invited to present.
Fast forward to October 10th, my first long-form viz was chosen as one of three finalists! I was of course super excited but humbled at the same time – did you SEE all the amazing the submissions? Have a look on Twitter under #vizforsocialgood and you will see what I mean – there was some amazing work done by everyone who participated. The other two finalists were Sarah Hodges (viz here) and Mike Moore (viz here, overall winning viz) – exceptional stuff.
Thank you again VFSG and B2P for the opportunity to participate in the project and for your assistance throughout. It is my sincere hope that our work will help spread awareness of B2P’s story and their impact on rural communities.
Here is the recording of the presentations from October 10th:

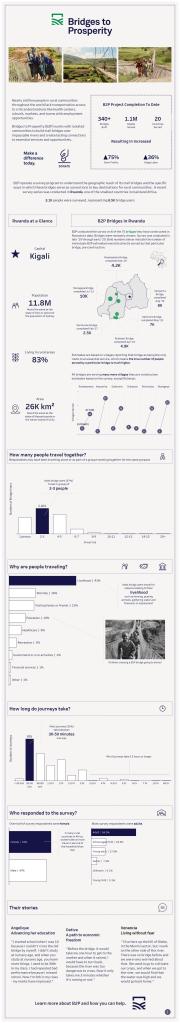
Here is an image of my B2P visualization. Click on it to view the interactive version on Tableau Public – there’s more detail when you hover over some of the charts with your mouse.
Key learning on this viz:
- First attempt at a long-form visualization
- Getting more familiar with how tiled layout containers behave in Tableau – they can be tricky!
Thanks for reading.
