I rarely use pie charts for various reasons (see death to pie charts for some), but since the data set for Makeover Monday (MOM) week 32 was a small one that could work as a pie and this month’s challenge in the Storytelling With Data (SWD) community was “make a perfect pie,” I thought I would get two-for-one with this exercise.
There were only six rows in the data. It related to the top reasons why 3,500+ survey respondents from around the world like working remotely – see here and here for details on the makeover.
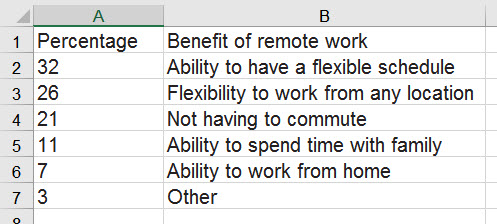
The original visualization
The original was presented as a stacked bar chart that was fairly clear – thankfully it added up to 100% (we see plenty of graphs in the wild that don’t when they should) – but it had a lot of real estate taken up by an unnecessary image. I also found it distracting that the colors in the bar seemed to match random things in the image (flexible schedule matches the lady’s hair, family time matches the bedding, etc.).

My approach
I wanted to make my pie simple with one call-out max, using color. I decided to combine the top two reasons since they were both related to flexibility and together they made up nearly 60%, which is a fairly big portion and worth calling out. When I did this it felt a bit too-summarized, which led me to adding in Tableau’s viz in tool tip function to allow the user to see more detail of the survey reasons when you hover with the mouse; problem solved.
I felt good about my pie, which was actually a donut, and was excited to use a pink and black color combination (check out this viz and this viz – very sharp!). I’m not a big fan of dark backgrounds in general, but since this was such a compact viz, I thought the colors could easily be inverted to make a “night version” and I could give the user the option to toggle between day and night modes, just for fun.
Navigation button
I hadn’t used navigation buttons before this viz – yes, I’m late to the navigation party – but it turns out creating this toggle is super easy. I had two dashboard sheets – one for day and one for night.
All you need to do is drag out a floating button and update the Navigate to field to the relevant dashboard sheet. Do the same with the corresponding dashboard sheet. The toggle works when you switch to presentation mode – voila! Lindsay Betzendahl has a blog post about creating buttons using shapes in Power Point and saving them as images so that you can use something other than Tableau’s default – clever! Use the layout tab (size/position section) on each dashboard sheet to make sure all of your objects and buttons are lined up on both so that when you toggle, it stays in the same spot.
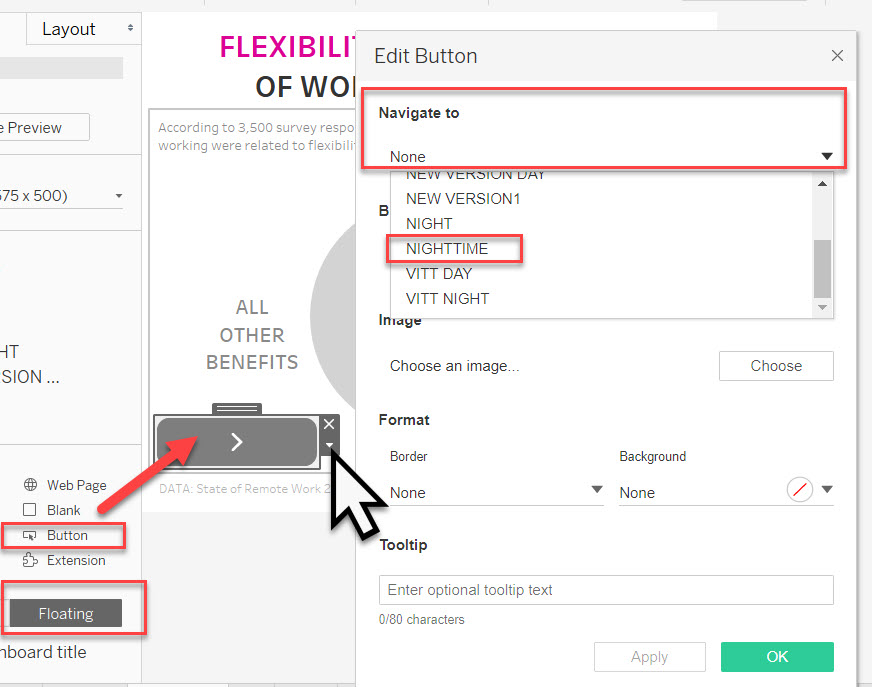
Adding a navigation button to dashboard sheet
Feedback and iteration
Finally, Sarah Bartlett kindly provided me with some feedback and after a few iterations and trying various button locations, I got to my finished product:
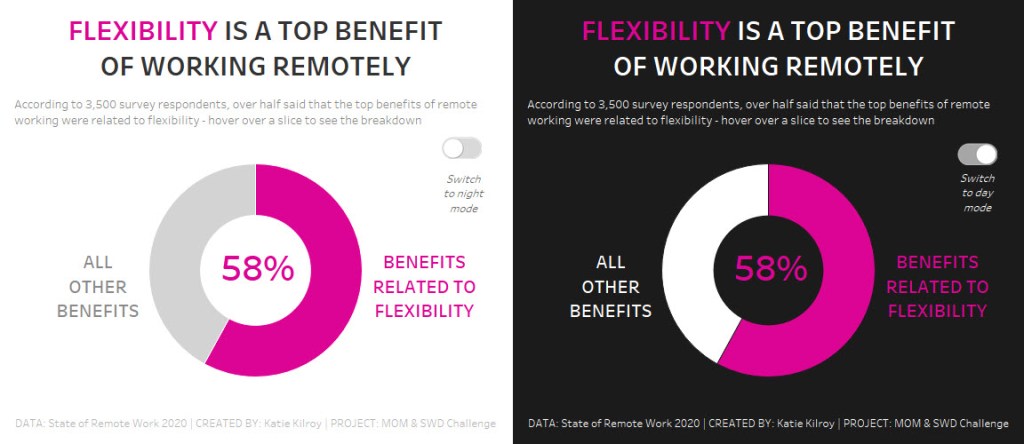
Version 1
Sarah came back to me with a new design idea from a book she was reading, so I gave that a try as well. It’s simple but I really like it. I tapped into The Noun Project for the house icon and Urban Fonts for the title and I left it as day mode only:

Version 2
Key learning with this viz:
- Navigation between dashboard sheets
- Perfecting alignment using the position section of layout panel
- Tried out two new design styles
Thanks for reading.
