
Tableau hosted a new event for Europe in November 2024 called DataFam Europe. It had some different flavors compared to its predecessors Tableau Conference Europe (organized by Tableau pre-Salesforce) and VizIt (organized by the Tableau Community). But given how much has changed for Tableau over the past number of years, that is to be expected.
DataFam Europe was another excellent opportunity to get inspired, learn, connect with others in the community, and stay current on the latest in the Tableau world. Let’s hope it becomes an annual event. And for the APAC DataFam… maybe there will be something similar for you in the future, too!
I wanted to summarize some my key takeaways and highlights:
Meeting People In Real-Life


Hands-down, the number one highlight of getting to the event was the people. Reconnecting with familiar faces, getting to know some new ones, and the inspiration gained by those conversations cannot be substituted. While for some occupations the world has moved to remote and hybrid forms of work, it’s more important than ever to maintain and reinforce connections by making contact in real life.
I was particularly excited to meet more of my fellow Forum Ambassadors IRL for the first time! By definition, we know each other from online forums. So the chance to meet in-person was a bonus.
The event was centrally-located in London and only had a few hundred attendees. It was easier to get around, find things, and meet people because you didn’t feel like you were lost in a sea of conference, which has been my experience at the main conference in the US. You saw the same faces a few times over the two days at DataFam Europe which I liked. The main conference is fantastic, I’m not knocking it – but the smaller event certainly has its appeal.
Quick shout to the Information Lab UK who hosted a pre-conference meet up on the Sunday night – thank you! This was a great opportunity to get a head start on the event, especially for those who traveled longer distances to get to London.
Natalie Nahai’s Keynote on Day One
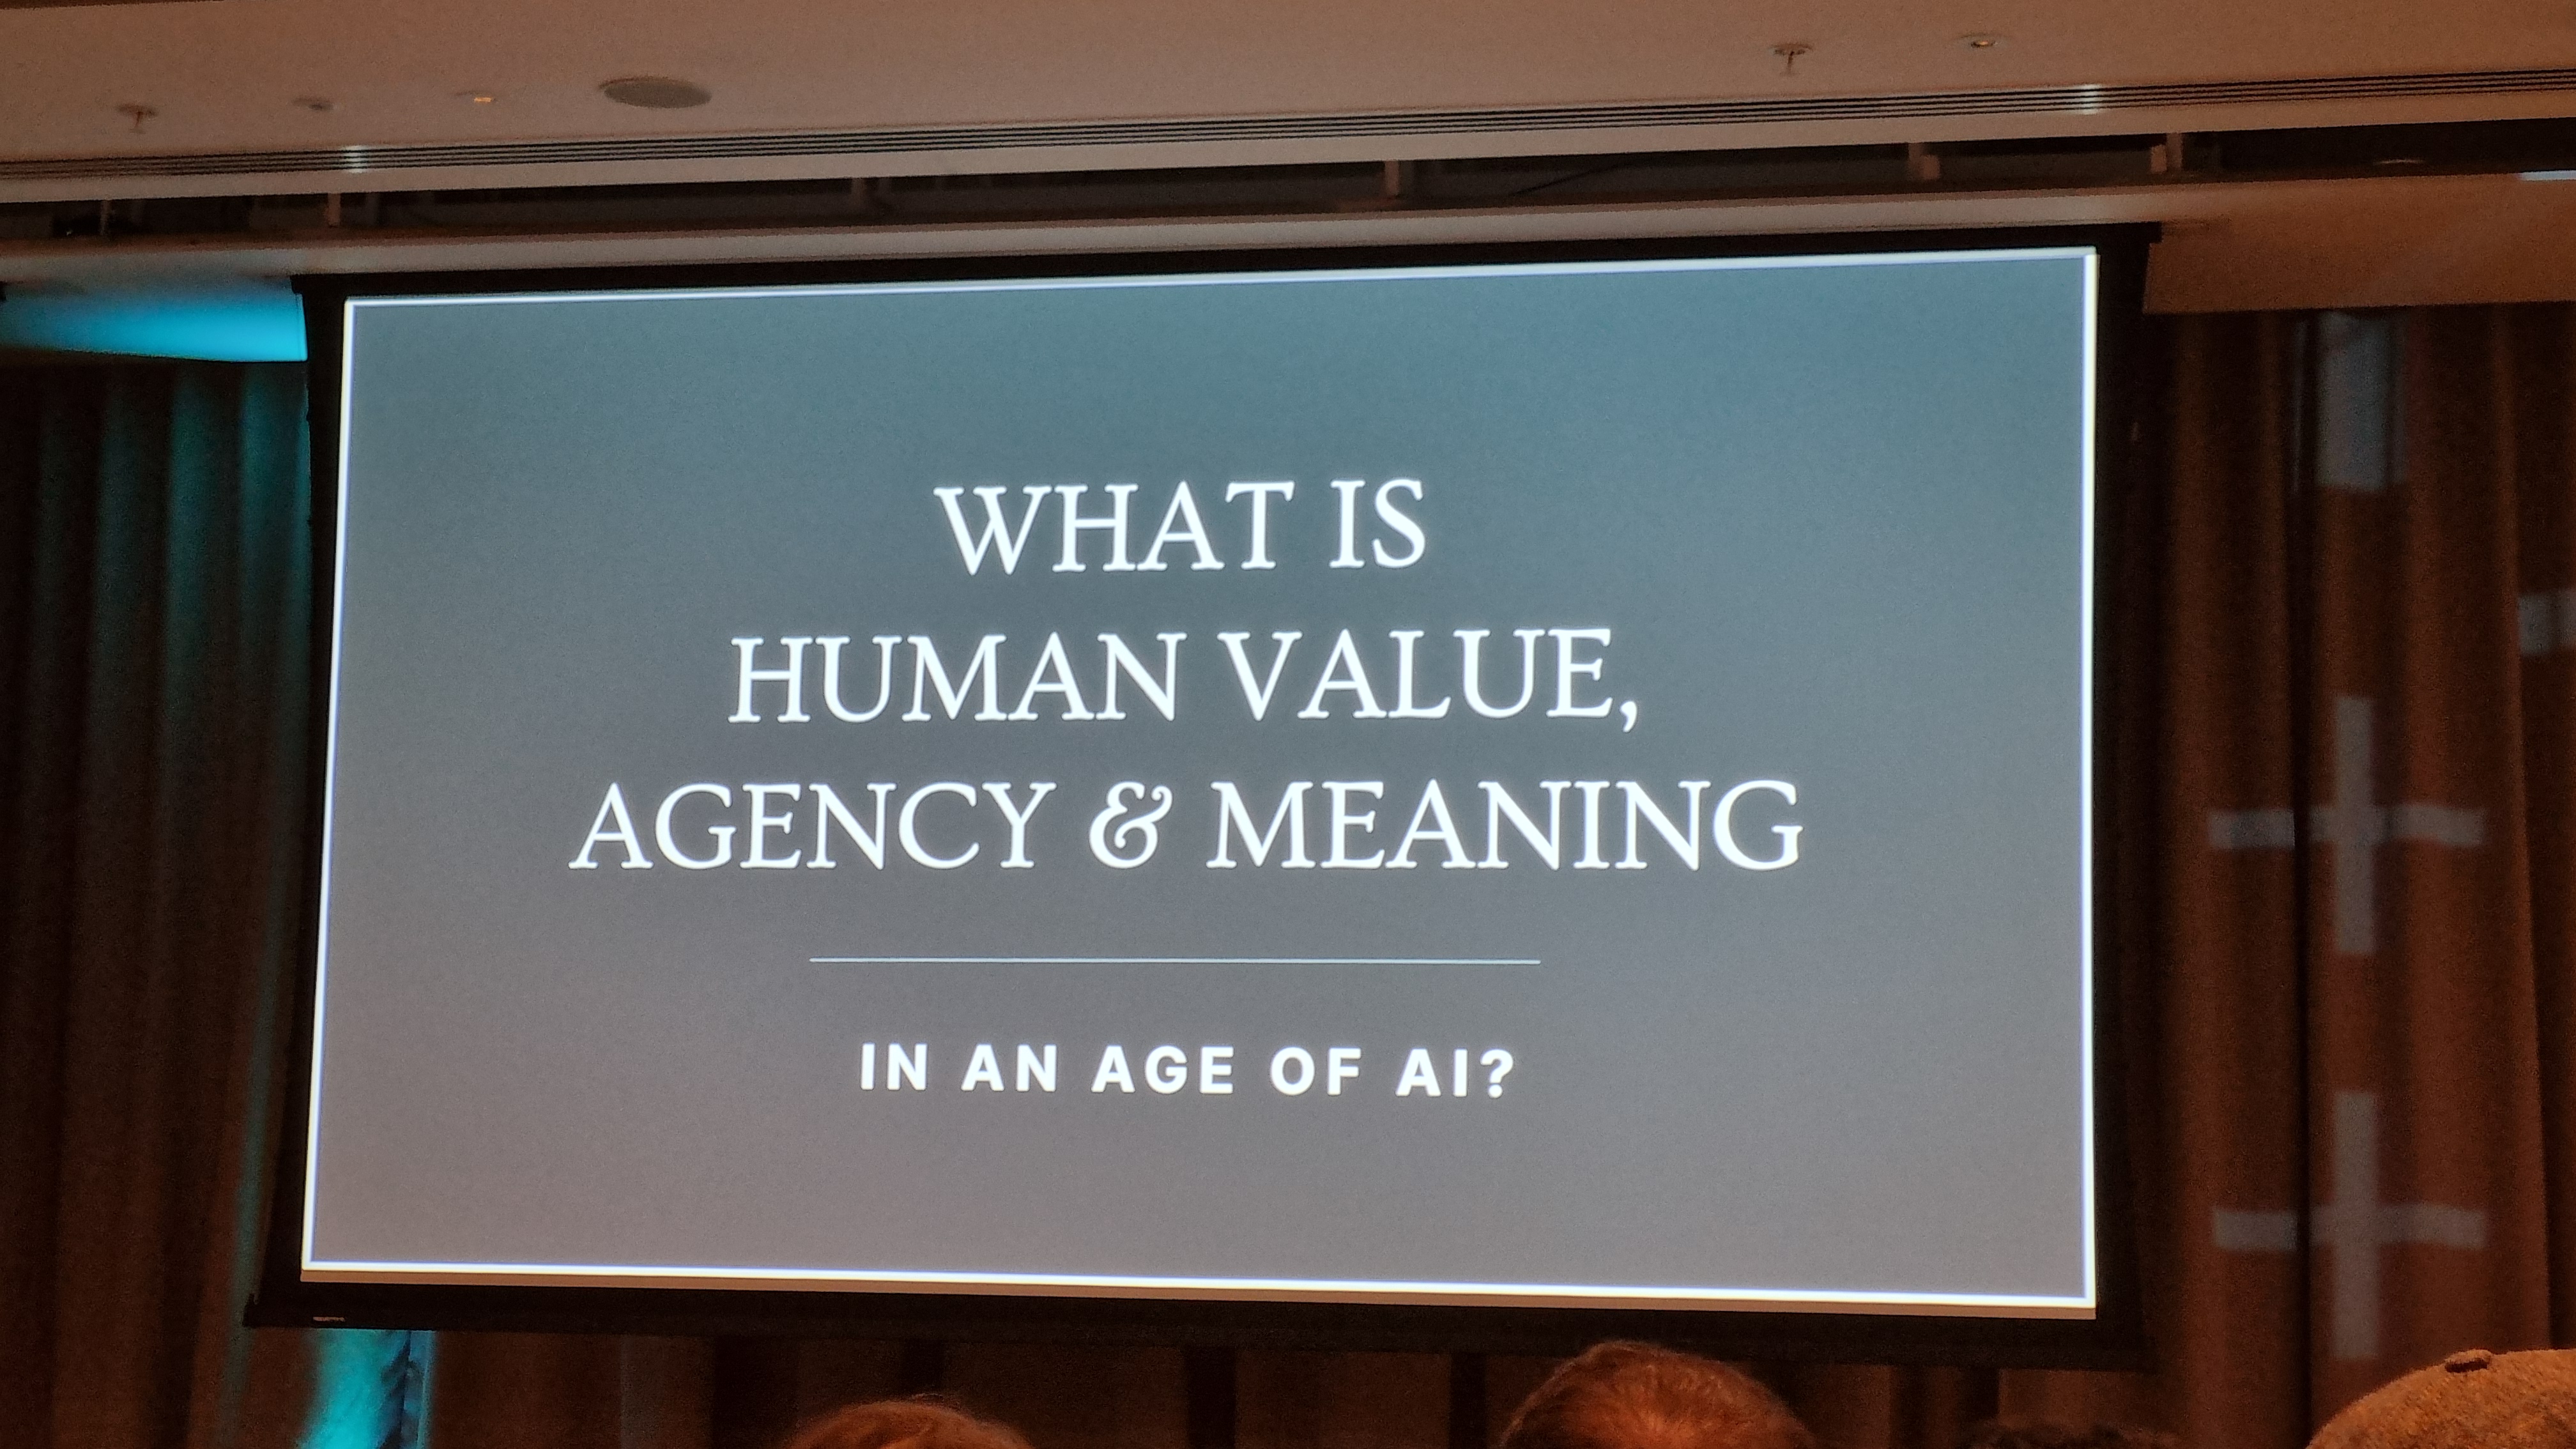

Wow. This was really good and if you aren’t familiar with her work, stop what you’re doing right now, look her up and bookmark her page and/or set an alarm to do so later when you have time. She presented some compelling ideas and questions specific to artificial intelligence that we should all consider as the story of AI intersecting with our everyday lives unfolds.
DataFam Slam

It felt like this was a new take on IronViz in that it was competition that most people at the conference probably attended and participated in.
For those who don’t know: the DataFam Slam was a friendly competition (with plenty of joking throughout, which kept it light) between two teams – one team from Tableau and the other from the Tableau Community. Each member of a team had to showcase some tips / tricks / features using the tool within a certain amount of time (maybe it was 2 minutes) while the crowd held up signs at the end of each round showing which team they believed to have won that round.
I preferred the DataFam Slam to IronViz, in terms of attending a live session at a conference, for a couple reasons: the focus was on teams rather than individuals, allowing more folks to ‘shine’ you could say, and it just felt lighter. IronViz is great, but it seems to have gotten a little too serious for my personal taste 😊 I also really liked that the attendees could benefit from the tips / demos shared by the contestants in real-time.
Top-Class Sessions
There was of course the Tableau Keynote and interactive “ask anything” Q&A session, attended by most folks there, but I’ll mention some of the other detailed sessions that I attended:
VizQL Data Service (VDS) API

VDS is a programmatic way to access and work with the data contained in data sources that are published to Tableau Server and Tableau Cloud… outside Tableau.
I joined two different sessions on it. First, a demonstration by Anya Prosvetova from Aimpoint Digital; and second, a hands-on training session with Kevin Glover and Nick Brisoux from Tableau/Salesforce. It was really useful to observe an example end-to-end and then later have the chance to spend a couple hours working through an example hands-on – with the added bonus of having live-human help available in the room!
Following the event, I was pleasantly surprised that there are already a few detailed blog posts written about the new feature. I’ll share some links below – it’s definitely worth checking out as it opens up the possibilities to interact with and make use of your Tableau data sources in new innovative ways.
- https://www.tableau.com/blog/vizql-data-service-beyond-visualizations
- https://kylejmassey.com/vizql-data-service-from-tableau-use-your-data-your-way/
- https://help.tableau.com/current/api/vizql-data-service/en-us/index.html
- https://priyankadobhal.medium.com/tableau-vizql-data-service-what-is-it-and-how-is-it-a-game-changer-b5dd0d29c8b5
Viz Extensions
I’ve been hearing about “viz extensions” for awhile now, but haven’t set aside the time to understand what they are and why you might want to use them. As the name suggests, a viz extension basically extends Tableau’s native capability so that you don’t need as many complex joins and/or calculations or hacks in the in the background to build certain chart types.
I joined two excellent sessions on this topic. First, Tristan Guillevin shared the latest and greatest from his company, Ladataviz, which was an eye-opener for me. Ladataviz have developed extensions that simplify the creation of some of the more complex chart types like sankeys, radars, network diagrams, and gauge charts. More recently they revealed their new ‘Filter Manager’ where you can edit the formatting and settings of multiple filters in bulk in Tableau. How many times have you gone through dozens of filters to update them to Multi-select with the Apply button? You can say goodbye to that with this product. He put out a post re-capping what he covered at DataFam Europe here, it’s worth a read!
The second session I joined on viz extensions was a hands-on-training hosted by the brilliant crew from InfoTopics. We worked through several examples using their products WriteBackExtreme, PowerKPIs, and SuperTables.
- WriteBackExtreme allows users to write back to the database within a dashboard and see the impact of the changes in the dashboard right away. My initial thought here was when would you want to allow end-users to do that? However the guys had some interesting use cases that make sense for write back.
- PowerKPIs is a solution for understanding business performance by providing insights to specific analytical questions. The output is presented as a ‘driver tree’ so that it makes it easy and quick to see how operational drivers affect financial performance. This was really neat – I can see how beneficial and easy this could be for business users in particular to consume… you just go up and down the tree and make your changes (like a filter) as you go. I suspect this would require your KPI definitions to be very clearly defined – as they should be anyways, right? – and your underlying data / data model be very well structured – again, as it should be 😊
- SuperTables is a tool that allows you to work with your data in Tableau but in a way that feels more like Excel. If you want to work like you’re in Excel, then why don’t you just use Excel, you might ask. I think what SuperTables does that is pretty powerful is allow users to stay where the data is and work in a way that’s familiar.
Data Detective
This session delivered by Agata Mezynska was great! She has since recorded the content and it can be found here. Have you ever inherited a workbook from another user and thought whaaat?? Agata shared her top-tips around what to look for when you take one of these on to make the process a little smoother.
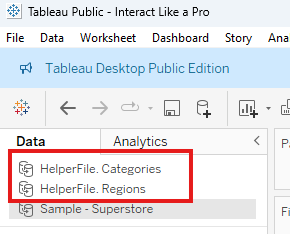
Using “Helper Files” for a Better User Experience


Carl Slifer from Aimpoint Digital had a great session on using dummy or “helper” files (for example in CSV or Excel format) to enhance your analysis or facilitate additional functionality in your Tableau workbooks that isn’t available natively. In short, you’d connect the helper file to your underlying data in the data source page and bend Tableau to your will.
I wasn’t able to find a blog post or presentation from him on the topic, but I did manage to find some workbooks on his Tableau Public page that applies the technique here and here. If you want to understand how it works you could download the workbook and reverse engineer his work.

For help on unpackaging a .twbx so that you can see the underlying data see here.
Closing
So those are my headlines from DataFam Europe 2024. I have come across other related blog posts and videos since then that I’ll share below to provide some other perspectives and insights on the event.
- There was a hands-on joint session between the Preppin’ Data and Workout Wednesday data projects – Donna Coles shared details here: https://donnacoles.home.blog/2024/11/15/datafam-europe-live-londons-top-attractions/
- Victor Munoz had a session related to Tableau Public – there’s a link within the page to the presentation slides as well: https://munozdataviz.com/resources/datafam-europe-2024
- Johan de Groot put together a nice post that even includes a short video with live action shots: https://antichaos.net/datafam-2024-london/
- A review of the event from the perspectives of Tim Ngwena and Ravi Mistry: https://www.youtube.com/watch?v=jQ2Z3b2cpcQ
Thanks for reading – and if we happen to be out at an event together but haven’t met, be sure to say hello!
